Wednesday, March 13, 2019

1.1c: Physiological Factors

1.1c Physiological Factors
Essential idea: Designers consider physiological factors to ensure products meet ergonomic needs. Designers study physical characteristics to optimize the user's safety, health, comfort, and performance.

Physiological factor data
Physiological factor data is available to designers and collected to optimize the user's safety, health, comfort, and performance. Human factor data related to physical characteristics used to optimize the mentioned user characteristics.

A recap on human factor design - it considers the:

  • effectiveness (completeness and accuracy)
  • efficiency (speed and effort)
  • engagement (pleasantness and satisfaction)
  • error tolerance (error prevention and error recovery)
  • learnability (predictability and consistency)
it also considers which activities can be caried out and how human values quality of life, improved safety, reduced fatigue and stress, increased comfort levels and job satisfaction and are enhanced. 

As human beings, we get used to the way things are really fast. But for designers, the way thing are is an opportunity to make things better and improve the human condition.

Image result for physiological data
Physiological Factors
How is physiological factor data collected?
Using a wide range of methods, such as performance testing, user trials and observations, collection of anthropometric data, and etc.

Comfort and fatigue
Comfort: How pleasing it feels to use a product, is one of the first things a human will notice. If something is not pleasant to the touch, people will not want to touch it or ultimately use or operate it. Comfort is of primary concern to the designers. It determines how effective a design is and how well a human can interact with a product.

Physical comfort: Designers need to find innovative ways to increase the utility of a product. Making an item intuitive and comfortable to use will ensure its success in the marketplace. Physical comfort while using an item increases its utility.

Psychological comfort: Comfort in the human-machine interface is found in feedback. You have preconceived notions of certain things. A quality product should feel like it is made out of quality materials. If it is lightweight and flimsy you will not feel that comfortable using it.

Fatigue: a person's sense of physical or psychological tiredness that inform decisions, and can affect a person's performance. Fatigue is a consequence of some discomfort experienced by the user and can lead to a loss in productivity, loss in quality of outcome and a perception that the product has been poorly designed.


Biomechanics
Biomechanics relates to the mechanics of living organisms and includes research into the operation of muscles, joints, and tendons. Biomechanics in human factor design deals with four key criteria:

  1. Force - Excessive impact jolts the user's joints and causes the muscles to tense in response.
  2. Repetition - Many work tasks and cycles are repetitive in nature, and are frequently controlled by hourly or daily production targets and work processes. High task repetition, when combined with other risk factors such as high force and/or awkward postures, can contribute to the formation of musculoskeletal disorder (MSD). A job is considered to be highly repetitive if the cycle time is 30 seconds or less.
  3. Duration - Refers to continuous muscular effort. Even small exertions continuously held are as stressful to the human tissues.
  4. Posture - Posture refers to "the carriage of the body as a whole, the attitude of the body, or the position of the arms and the legs". It is the position in which you could hold your body upright against gravity while standing.
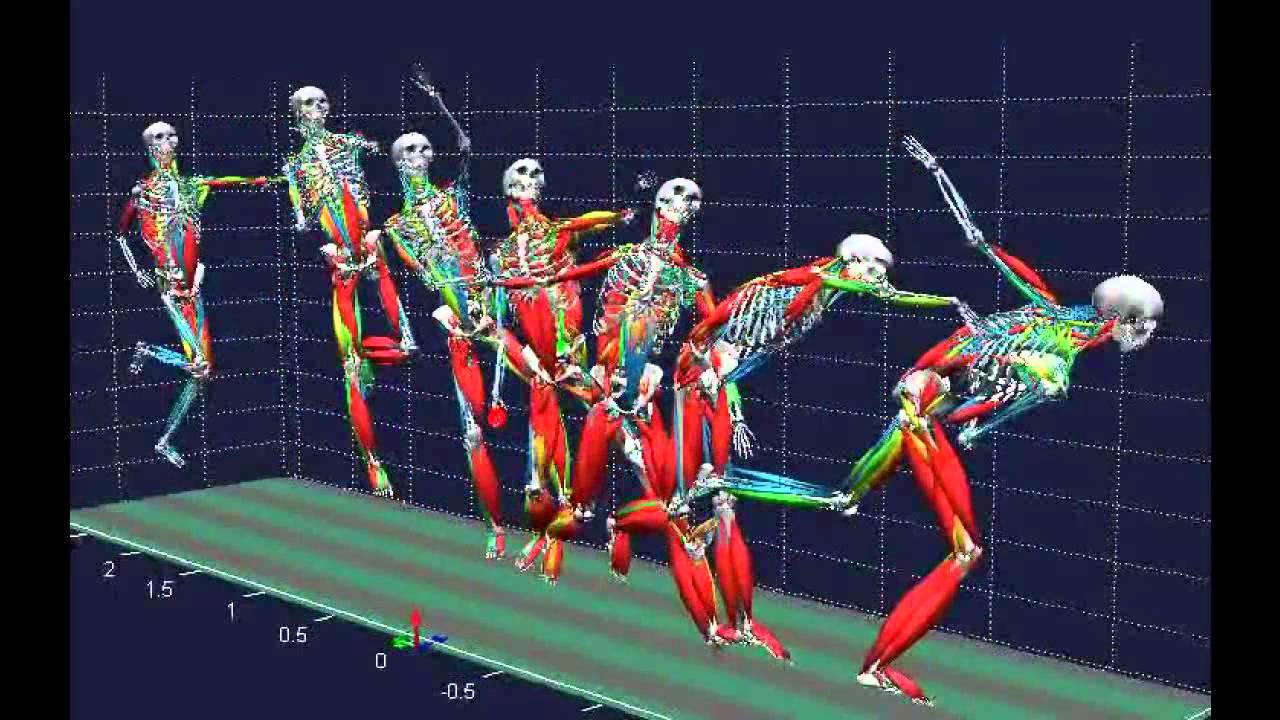
Image result for biomechanics

The importance of biomechanics to the design of different products considering muscle strength, age of user, user interface (surface texture,  handle size, etc) and torque.

- In a kitchen: viewing distances, pulling strength, lifting strength and turning strength.
- In a can opener, valve wheel, corkscrew, door handle, jam jar lid – torque becomes important.

Wednesday, March 6, 2019

1.1b: Psychological Factors

1.1b
Psychological Factors
Human beings vary psychologically in complex ways. Any attempt by designers to classify people into groups merely results in a statement of broad principles that may or may not be relevant to the individual. Design permeates every aspect of human experience and data pertaining to what cannot be seen such as touch, taste, and smell are often expressions of opinion rather than checkable fact.
The analysis of the human information processing system requires a designer to critically analyse a range of causes and effects to identify where a potential breakdown could occur and the effect it may have.

Methods of Collecting Psychological Data
Nominal Scales
Nominal scales are used for labelling variables without any quantitative value - they are simply named or labelled. All of these scales are mutually exclusive in the sense that there is no overlap and none of them have any numerical significance.
Nominal Scale
Example of Nominal Scale
Interval Scales
Interval scales are numeric scales in which we know not only the order, but the exact differences between the values. The classic example of an interval scale is Celsius temperature because the difference between each value is the same. 
Interval Scale
Interval Scale
Ordinal Scales
Ordinal scales place an importance on the order of the values on a scale. They are typically measures of non-numeric concepts like satisfaction, happiness, discomfort, etc.

Ordinal Scale
Example of Ordinal Scale
Ratio Scales
Ratio scales tell us the order, the exact value between units, and they also have an absolute zero - which allows for a wide range of both descriptive and inferential statistics to be applied.
Ratio Scale
Ratio Scale

Methods of Collecting Psychological Factor Data
  • Interviews
An interview involves asking people questions to find out about their experiences and attitudes. One problem of interviewing people is the concern of participants to tell the interviewer what they think is socially acceptable or desirable.
  • Surveys or questionnaires
These require subjects to read questions and mark their answers. Some psychologists observe behavior and mental processes by administering standardized tests.
  • Observation
  • Standardised tests
  • Case Studies

Sunday, March 3, 2019

10.4: Quality Management

10.4
Quality Management
Essential Idea: Quality management focuses on producing products of consistent required quality.

Quality control (QC) [process]
Quality control: Tolerances (an acceptable amount of defect) are defined at the design stage of the product. Parts not within tolerance need to be reworked or scrapped. Continuous monitoring ensures that machines perform to the predetermined standard/quality.

Quality control at the source eliminates waste from defects as the workers are responsible for the quality of work they do.

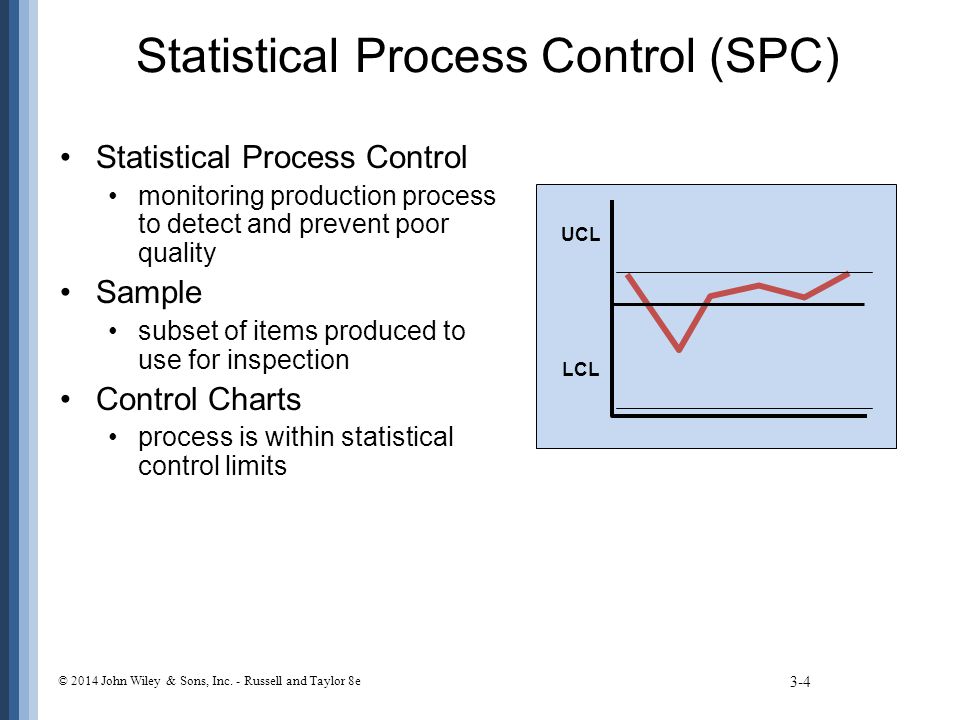
Statistical process control (SPC)
This is a quality control tool that uses statistical methods to ensure that a process operates at its most efficient. This is achieved through measuring aspects of a component to ensure that it meets the required standard throughout its production in order to eliminate waste.

Related image

Real time SPC contributes and assists with:

  • Reducing costs
  • Improving productivity
  • Decision making in real time
  • Reducing waste
  • Reducing variability in outcome
  • Discovering abnormalities
  • Speeding up process changes
Image result for statistical process control

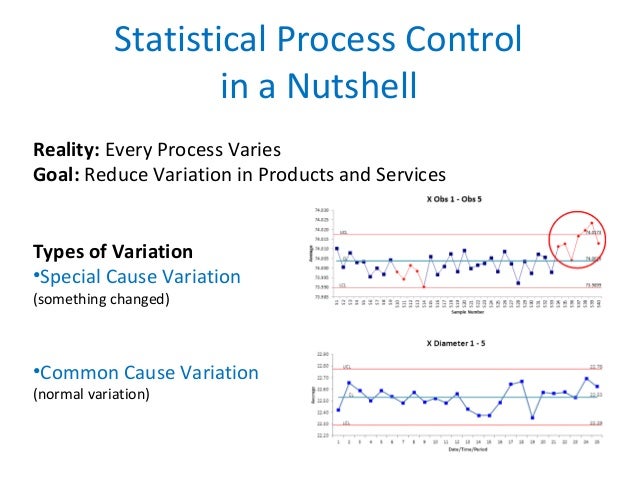
Statistical Process Control Charts:
Related image


Quality assurance (QA) [product]

This covers all activities from design to documentation. It also includes the regulation of the quality of raw materials, assemblies, products and components, services related to production, and management and inspection processes. 

Quality assurance is a way of preventing mistakes or defects in manufactured products and avoiding problems when delivering solutions or services to customers. Defect prevention in quality assurance differs subtly from defect detection and rejection in quality control, and has been referred to as a shift left as it focuses on quality earlier in the process.


Image result for quality assurance framework
Quality Assurance Framework

The Differences between QA, QC and SPC
QA is process oriented while QC is product oriented. QA deals in developing processes and systems that align with Quality Management. QC on the other hand deals with monitoring products.

For example, a QA engineer would develop a quality plan based on customer requirements and a QC engineer would monitor and ensure that all requirements of the quality plan are met during manufacturing. The QC engineer would only focus on making sure the product meets the requirements of the quality plan as set by the QA.

QA is the part of QM focused on providing confidence that quality requirements will be fulfilled. 

QC is the part of QM focused on fulfilling quality requirements. 
Differences between QC and QA


10.3: Computer Integrated Manufacturing

10.3
Computer Integrated Manufacturing
Essential Idea: Computer-integrated manufacturing uses computers to automatically monitor and control the entire production of a product.

Computer integrated manufacture (CIM) takes the concept of integration of separate manufacturing technologies and combines these with all aspects of a company's operations, not just those that are directly involved in the manufacture/

Under a CIM system, all teams can share the same information and easily communicate with one another. A CIM system uses computer networks to integrate the processing of production and business information with manufacturing operations to create cooperative and smooth-running production lines.


Elements of CIM: design, planning, purchasing, cost accounting, inventory control, distribution

DESIGN

  • In a CIM system this is accomplished by a design department through computer aided design while considering the product requirements. 
  • When design is completed it is tested or functions simulated on a screen before a prototype is made
  • Prototypes are maid using CIM machines
  • The design process creates the database required to manufacture the part

PLANNING

  • Planning department takes the design on the computer system and database established by the design department and enriches it with production data to produce a plan for the most efficient method of production of the product
  • Involves subsystems dealing with materials, facility, process, tools, manpower, capacity, scheduling, outsourcing, assembly, inspection, logistics and others.

PURCHASING

  • The purchase department orders the necessary materials to manufacture the product, keeping cost to a minimum
  • Just in time (JIT) philosophy is applied
  • Computer system is used to purchase orders and follow up, ensure quality in the production process of the vendor, log the received items, and more.
COST ACCOUNTING 

  • The finance department uses a computer system to deal with the financial resources of a company 
  • Such factors of cost accounting include:
    • Inventory valuation
    • Cost of goods sold valuation
    • Constraint analysis
    • Margin analysis
    • Variance analysis
    • Budgeting
INVENTORY CONTROL

  • Computerized inventory control systems make it possible to integrate the various functional subsystems that are a part of the inventory management into a single cohesive system.
  • An inventory control system encompasses all aspects of managing a company's inventories including:
    • Purchasing 
    • Shipping 
    • Receiving
    • tracking
    • Warehousing and storage
    • Turnover
    • Reordering

DISTRIBUTION

  • Distribution (or warehousing uses the computer system to aid in organizing the storage and retrieval of raw materials, components, finished goods as well as the shipment of items
  • Storage is automated using computer controlled vehicles that move the finished product from the manufacturing area to storage (and keeps track of the products)
  • Logistics and supply chain management assume great importance


Monday, February 18, 2019

1.1a: Anthropometrics

1.1a
Anthropometrics
Essential idea: Designers consider anthropometrics to ensure products meet ergonomic needs.


Design is human centered and, therefore, designers need to ensure that the products they design are the right size for the user and therefore comfortable to use. Designers have access to data and drawings, which state measurements of human beings of all ages and sizes. Designers need to consider how users will interact with the product or service. Use and misuse is an important consideration.


Human Factors
The term Human Factors is used for the combination of ergonomics and anthropometrics. Human Factors is also known as comfort design, functional design, and user-friendly sytems, is the practice of designing products, systems, or processes to take proper account of the interaction between them and the people that use them.

Human Factors aims to:

  • Reduce stress and fatigue on people, as they will be able to do things faster, more easily, more safely and make less mistakes (reduced errors)
  • Increases safety
  • Increase ease of use
  • Enhance operational comfort
  • Improve system performance, reliability and maintenance
Image result for ergonomic design
Using anthropometrics to design ergonomic products

Anthropometric data: static and dynamic data, structural and functional data
Anthropometrics is the study of the different sizes of people. Knowing the sizes of people and their body parts aids designers in the development of products and spaces which are comfortable or adjustable and increases the ease of use.

Design is human/user centered so designers need to ensure that the products they design are the right size for the user and comfortable to use.

Anthropometric data can be presented as a percentile range graph (bell shape curve) which shows the proportion of the population with a particular dimension:

Image result for anthropometric graph

ANTHROPOMETRICS DEFINITION
The aspect of ergonomics that deals with body measurements, particularly those of size, strength and physical capacity.

Sub-classifications of anthropometric data:

  1. Static Data 
    Static data refers to measurements taken while the subject is in a fixed or standard position, for example their height, or arm length.
  2. Dynamic Data
    Also known as functional data, dynamic data refers to measurements taken during physical activities, for example their crawling height, overhead reach, and a range of upper body movements. 


Primary Data vs. Secondary Data

Percentiles and Percentile Ranges
Percentile ranges are proportions of a population with a dimension at or less than a given value. For a given demographic (gender, race, age), the 50th percentile is the average.
Image result for percentile ranges
The 5th percentile mark is the point below which 5% of the population is represented on the graph. 

At the end of the scale, if you were designing an airplane cockpit, and needed to make sure everyone could reach a particular control, you would need to choose the 5th percentile arm length, because the people with the short arms are the most challenging to design for. If they could reach the control, then everyone else, with longer arms, would be able to.

The 95th percentile mark is similarly the point above which the tallest 5% of the population are represented. 

Usually you will find that if you pick the right percentile 95% of the people will be able to use your design. For instance if you were choosing a door height, you would choose the dimension often known as the stature, and pick the 95% percentile value in other words design for the taller people. You would not need to worry about the average height or the 5th percentile one as they would be able to fit through the door anyway.

Range of Sizes vs. Adjustability
Products are designed to allow a variety of users to be able to access and use. This may be based around the idea of provides a range of sizes or the product is adjustable to accommodate different users.

Range of sizes: A selection of sizes a product is made in that caters for the majority of a market.

For example, clothing comes in a range of sizes. For manufacturers to make clothing fit, every individual variance would not be economically possible, thus it tends to come in a range of sizes based on percentile ranges.

Adjustability: The ability of a product to be changed in size, commonly used to increase the range of percentiles that a product is appropriate for.

Multivariate accommodation (fitting in several variables, for example, in a car you need to fit in terms of sitting height, leg room, arm reach, viewing angles, hip breadth, thigh length) means that accepting 5% being designed out for each important dimension is not viable, because different people will be designed out for each variable.

People have different proportions. Those designed out because they are too tall may not be the same as those designed out because their arm reach is too short.

Clearance, Reach, and Adjustability
Clearance
Sometimes people or machines have to move through or work in restricted areas, for example, maintenance work. Clearance provides access for the 95th percentile, and is considered in ubiquitous amenities such as a service cover or emergency exits.

Reach 
Reach is also known as the workspace envelope. A workspace envelope is a 3-dimensional space within which you can carry out physical work activities when you are at a fixed location. 

Image result for workspace envelope
Should be designed for the 5th percentile of the user population


Designing through context: Aims in design 


Sunday, February 17, 2019

10.3: Computer Integrated Manufacturing (CIM)

10.3
Computer Integrated Manufacturing (CIM)
Essential idea: Computer-integrated manufacturing uses computers to automatically monitor and control the entire production of a product.

Computer Integrated Manufacture
CIM is a system of manufacturing that uses computers to integrate the processing of production, business and manufacturing in order to create more efficient production lines. Under a CIM system, all teams can share the same information and easily communicate with one another.

A CIM system uses computer networks to integrate the processing of production and business information with manufacturing operations to create cooperative and smooth-running production lines.
Image result for computer integrated manufacturing
Elements of CIM

Design 
In a CIM system, this is accomplished by a design department through computer aided design while considering the product requirements.

Planning

The planning department take the design and on the computer system and database established by the design department and enriches it with production data and information to produce a plan for the most efficient method production of the product.

Purchasing
The purchase department through the computer system orders the necessary materials to manufacture the product, keeping costs to a minimum.This means that materials/components are ordered as needed (JIT).

Cost accounting
The finance department uses a computer system to deal with the financial resources of a company. Planning of investment, working capital, and cash flow control, realization of receipts, accounting and allocation of funds are the major tasks of the finance departments.

Inventory control
Computerized inventory control systems make it possible to integrate the various functional subsystems that are a part of the inventory management into a single cohesive system. 

Distribution
Distribution (or warehousing) uses the computer system to aid in organizing the storage and retreival of raw materials, components, finished goods as well as shipment of items. 

10.2: Lean Production

10.2 
Lean Production
Essential idea: Lean production aims to eliminate waste and maximise the value of a product based on the perspective of the consumer.

Lean production considers product and process design as an ongoing activity and not a one-off task, and should be viewed as a long-term strategy.

Image result for lean production

Characteristics of lean production

Lean production aims to eliminate waste and maximize the value of a product based on the perspective of the consumer. Such characteristics include:

  1. Jit supplies
    Getting the right amount of material to the production line JIT
  2. Highly trained multi-skilled workforce
    Having experts in place to ensure that no time is wasted
  3. Quality control and continuous improvement 
    Checks are made at every stage of production to quickly identify and fix any problems that arise. Improvements to the system are actively sought.
  4. Zero defects 
    Ensuring that time, material and energy are not wasted producing a sub-standard product
  5. Zero inventory
    Products are manufactured JIT to be sold
Image result for lean production
Focuses on continual feedback and incremental improvement

Lean Production


Principles of Lean Production
There are several key principles of lean production. If any of these principles are not met this could result in failure or a lack of commitment.  Without commitment the process becomes ineffective.

10 principles of lean production:

  1. Eliminating waste
  2. Minimizing inventory
  3. Maximizing flow
  4. Pulling production from customer demand
  5. Meeting customer requirements
  6. Doing it right the first time
  7. Empowering workers
  8. Designing for rapid changeover
  9. Partnering with suppliers
  10. Creating a culture of continuous movement

Value Stream Mapping
Value stream mapping is a lean production management tool used to analyze current and future processes for the production of a product through to delivery to the consumer. Consider the contribution of value stream mapping to the design of an effective lean production method.
Image result for value stream mapping
Value stream mapping allows production managers to plan the manufacture of a product from start (purchase of raw materials) to finish (sale to customer) and identify potential problems in the system.

  • helps to identify Value and Waste in production


Workflow Analysis
Workflow analysis is the review of workflow processes in order to identify potential improvements. Value stream mapping provides a 'big picture' of the manufacturing processes, but workflow analysis is concerned with the details of the production line.

Identifies potential improvements by considering the sequence, tools and even worker movement to ensure the highest possible efficiency in the system.


Product Family
The concept of standardized specifications, components or assemblies within a product family or associated brands allows companies to create a competitive advantage. A product family is a group of products using similar processing methods.

Image result for apple products

Role of the Workforce
The development of a highly skilled workforce can build deep understanding of how the production process works and allows workers at all levels to identify areas of the workflow to be improved.


  • reduces costs 
  • empowers the workforce
  • gives them a sense of ownership and loyalty to the company 

Kaizen
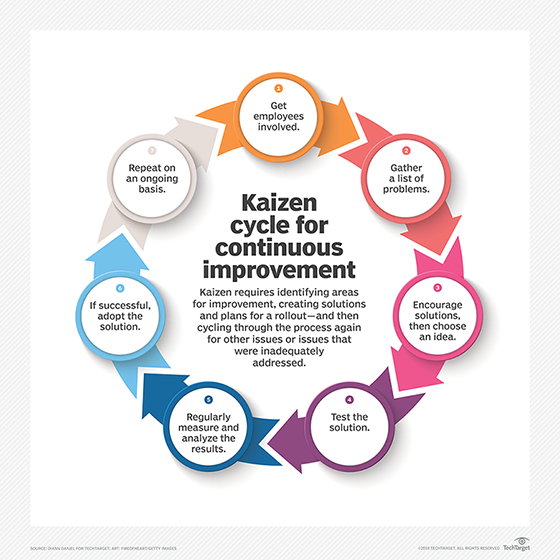
Kaizen is a culture of continuous improvement originating in Japan and considered an important aspect of an organization's long-term strategy. It is a philosophy and commitment to continuous process and product improvement of processes in manufacturing, engineering, business management or any process.
Image result for kaizen

Image result for toyota kaizen methods
Toyota as a company embraces the ways of Kaizen in their manufacturing


Lead time
Lead time refers to the time quoted to customers (usually in days or weeks) between the date of purchase and the date of delivery. (The time between the initiation and the execution of a process)

In industry, lead time reduction is an important part of lean manufacturing.
Image result for lead time in manufacturing
The 5 Ss: sorting, stabilizing, shining, standardizing, sustaining the practice
The Five S's are a formal approach to cleaning and organizing the workplace involving these five steps;

  • Sort
  • Set
  • Shine
  • Standardize
  • Sustain
7 Wastes


The 7 wastes: overproduction, waiting, transporting, inappropriate processing, unnecessary inventory and unnecessary/excess motion.
7 Wastes
Of all these wastes, overproduction is the worst as it inherently incorporates all of the others. When you manufacture a product that will never be sold, the following happens;

  • The raw material used is wasted
  • The energy of the manufacturer is wasted
  • The time and movement of the workers is wasted
  • The transportation of the raw material and the finished product is wasted

Advantages and Disadvantages of Lean Production
Advantages

  • Minimizes waste, reduces cost
  • less impact on the environment
  • Quickly adaptable to the market pushes
  • Little capital is tied up in raw material or unsold stock
  • Increased autonomy for workers - leading to higher moral
Disadvantages
  • One problem in production stops the whole process
  • Manufacturers rely on suppliers, one mistake by them halts production
  • More suitable for large scale production
  • When a certain level of refinement is met, using lean methods to squeeze more economy from production can discourage workers, reversing positive motivation and undermining your leadership


3.3 Physical Modelling

3.3 Physical Modelling Essential Idea: A physical model is a three-dimensional, tangible representation of a design or system Designers ...